Key Achievements
How we care for the Earth
Environmental Management Data
Kia’s entire operating system is undergoing an evolution in order for our vehicles to contribute as "Clean Mobility" on global environmental protection.
Furthermore, by 2025, we will have reduced direct (Scope 1) and indirect (Scope 2) greenhouse gas emissions by 17.4 percent compared to 2016.
Greenhouse Gas and Energy Use
GHG Emissions (Scope 1&2)
(1000 tCO2-eq)
| Category | 2022 | 2023 | 2024 |
|---|---|---|---|
| Total emissions (Scope 1&2)1 | 1,166.9 | 1,130.9 | 1,178.5 |
| Direct emissions (Scope 1) | 379.9 | 354.0 | 386.3 |
| Domestic | 266.0 | 244.6 | 238.6 |
| Overseas | 113.9 | 109.3 | 147.7 |
| Indirect emissions (Scope 2) | 787.0 | 776.9 | 792.2 |
| Domestic | 467.3 | 454.4 | 471.2 |
| Overseas | 319.6 | 322.6 | 321.0 |
* Since 2024, emissions from leased assets, which were previously classified under Scope 3 Category 8, have been included in Scope 1&2 calculations
GHG Emissions (Scope 3)
(1000 tCO2-eq)
| Category | 2022 | 2023 | 2024 |
|---|---|---|---|
| Total emissions(Scope 3) | 72,975.5 | 99,498.2 | 99,395.2 |
| Purchased Goods and Services1 | 13,736.3 | 17,176.3 | 18,437.9 |
| Capital goods2 | 2.5 | 1.9 | 112.3 |
| Fuel-and energy-related activities not included in Scope 1&2 3 | 99.3 | 185.8 | 208.7 |
| Upstream transportation and distribution4 | - | 35.0 | 94.7 |
| Waste generated in operations5 | 30.8 | 60.9 | 56.8 |
| Business travel6 | 5.1 | 11.1 | 23.5 |
| Employee commuting7 | 277.6 | 47.9 | 57.8 |
| Upstream leased assets | - | 4.5 | - |
| Downstream transportation and distribution8 | 1,153.6 | 1,311.6 | 1,188.5 |
| Use of sold products9 | 57,390.0 | 79,327.6 | 77,804.5 |
| End of life treatment of sold products10 | 189.0 | 1,199.1 | 1,267.6 |
| Investments11 | 91.3 | 136.4 | 142.8 |
1. Emission factors for key raw materials (e.g., steel, aluminum, plastic) are applied based on the global LCI database, including Scope 1&2 emissions from major domestic emitting partners
2. Emissions generated during the production of purchased capital goods (e.g., buildings, structures, machinery)
3. Upstream emissions of used energy (electricity, LNG, gasoline, diesel, etc.)
4. Emissions from the transportation and logistics of components
5. Emissions from waste processing at business sites
6. Emissions generated from transportation methods used for employee business trips
7. Emissions generated from transportation methods used during employee commuting
8. Emissions from the transportation and logistics of products (finished vehicles)
9. Use phase emissions generated after 200,000 km of driving (excluding Well-to-Tank emissions)
10. Emissions from recycling, incineration, and landfill processes
11. Emissions from domestic corporate entities with a 20-50% shareholding
Energy Consumption
Total energy consumption (general + renewable)
| Category | Unit | 2022 | 2023 | 2024 |
|---|---|---|---|---|
| Total | MWh | 3,794,359 | 3,637,639 | 3,869,712 |
| Domestic | MWh | 2,467,659 | 2,322,506 | 2,327,178 |
| Overseas | MWh | 1,326,700 | 1,315,133 | 1,542,534 |
| Total | TJ | 19,763 | 19,036 | 20,112 |
| Domestic | TJ | 14,987 | 14,301 | 14,559 |
| Overseas | TJ | 4,776 | 4,734 | 5,553 |
Air Pollutants
Dust
| Category | 2022 | 2023 | 2024 |
|---|---|---|---|
| Emissions(tons) | 71.6 | 65.6 | 82.4 |
| Emission intensity (tons/KRW trillion) |
1.5 | 1.1 | 1.3 |
* Data coverage : Domestic
SOx
| Category | 2022 | 2023 | 2024 |
|---|---|---|---|
| Emissions(tons) | 6.1 | 19.9 | 9.2 |
| Emission intensity (tons/KRW trillion) |
0.1 | 0.3 | 0.1 |
* Data coverage : Domestic
NOx
| Category | 2022 | 2023 | 2024 |
|---|---|---|---|
| Emissions(tons) | 155.2 | 127.5 | 110.5 |
| Emission intensity (tons/KRW trillion) |
3.3 | 2.7 | 1.7 |
* Data coverage : Domestic
THC/VOC
| Category | 2022 | 2023 | 2024 |
|---|---|---|---|
| THC emissions per unit area(g/㎡) | 33.0 | 27.1 | 25.5 |
| VOC emissions(ton) | 100.5 | 58.0 | 47.2 |
| VOC emissions intensity (ton/KRW trillion) |
2.2 | 1.0 | 0.7 |
* Data coverage : Domestic
Water Resource and Water Pollutants
Water
(ton)
| Category | 2022 | 2023 | 2024 |
|---|---|---|---|
| Total water intake | 7,006,517 | 6,343,388 | 6,516,768 |
| Water intake from high water stress areas1 | 1,633,092 | 1,421,762 | 0 |
| Total water withdrawal | 4,737,786 | 4,645,326 | 4,776,932 |
| Water withdrawal to high water stress areas1 | 1,409,389 | 1,279,843 | 0 |
| Total consumption | 2,268,731 | 1,698,062 | 1,739,836 |
| Water consumption in high water stress areas1 | 223,703 | 141,919 | 0 |
| Amount of reuse | 324,827 | 269,342 | 284,129 |
* Data coverage : Domestic
1. 2022, 2023 : AutoLand Gwangmyeong, 2024 : AutoLand Gwangmyeong is excluded from water stress areas
※ Water stress refers to the ratio of water demand to available water resources. A higher value indicates a more acute water scarcity region.
It is a representative tool to identify water stress areas with reference to the Water Risk Atlas of the World Resources Institute (WRI).
COD
| Category | 2022 | 2023 | 2024 |
|---|---|---|---|
| Emissions(tons) | 82.2 | 67.4 | 65.2 |
| Emission intensity (tons/KRW trillion) |
1.8 | 1.2 | 1.0 |
* Data coverage : Domestic
TOC
| Category | 2022 | 2023 | 2024 |
|---|---|---|---|
| Emissions(tons) | 51.4 | 42.1 | 40.8 |
| Emission intensity (tons/KRW trillion) |
1.1 | 0.7 | 0.6 |
* Data coverage : Domestic
BOD
| Category | 2022 | 2023 | 2024 |
|---|---|---|---|
| Emissions(tons) | 22.8 | 14.8 | 18.7 |
| Emission intensity (tons/KRW trillion) |
0.5 | 0.3 | 0.3 |
* Data coverage : Domestic
SS
| Category | 2022 | 2023 | 2024 |
|---|---|---|---|
| Emissions(tons) | 7.7 | 10.4 | 8.0 |
| Emission intensity (tons/KRW trillion) |
0.2 | 0.2 | 0.1 |
* Data coverage : Domestic
Raw and Subsidiary Materials / Waste
| Category | 2022 | 2023 | 2024 |
|---|---|---|---|
| Total usage(tons) | 267,267.7 | 281,528.8 | 279,539.1 |
| Intensity of use(kg/unit) | 211.0 | 208.1 | 217.3 |
* Data coverage : Domestic
* Main raw materials(Iron, Thinner, Paint, Aluminum)
Waste generation
| Category | 2022 | 2023 | 2024 |
|---|---|---|---|
| Total waste generated(ton) | 199,933.7 | 231,938.1 | 208,417.8 |
| General | 191,796.1 | 222,292.1 | 198,900.5 |
| Designated | 8,137.6 | 9,646.0 | 9,517.3 |
| Waste generation intensity(ton/KRW trillion) | 4,308.0 | 3,963.4 | 3,294.8 |
* Data coverage : Domestic
Waste recycling
| Category | 2022 | 2023 | 2024 |
|---|---|---|---|
| Total waste recycled(ton) | 187,593.4 | 216,537.4 | 194,858.9 |
| General waste recycled | 183,852.6 | 212,110.7 | 190,170.5 |
| Designated waste recycled | 3,740.8 | 4,426.7 | 4,688.4 |
| Total recycling ratio(%) | 93.8 | 93.4 | 93.5 |
* Data coverage : Domestic
Waste treatment
| Category | 2022 | 2023 | 2024 |
|---|---|---|---|
| Total waste treated(ton) | 12,340.2 | 15,400.7 | 13,558.9 |
| General waste treated | 7,943.4 | 10,181.4 | 8,730.0 |
| Designated waste treated | 4,396.7 | 5,219.4 | 4,828.9 |
* Data coverage : Domestic
Chemicals
| 2022 | 2023 | 2024 | |
|---|---|---|---|
| Chemical substance disposal intensity(ton/KRW trillion) | 57.6 | 36.2 | 27.0 |
| Hazardous chemical substance disposal intensity(kg/unit) | - | - | - |
Environmental Training
| Education course | Subject to education | No. of employees educated | Date | Purpose |
|---|---|---|---|---|
| Safety and Environment New employee Training | New hires and personnel related to the safety and environment team | 60 | March-May 2024 | To ensure effective job performance in the safety and environment team |
| Regular Safety and Health Training | All employees | 34,265 | Sep-24 | To raise awareness among employees about chemical safety management, including hazardous substances and MSDS |
Biodiversity
Kia acknowledges its dependence on natural ecosystems and takes measures to safeguard the environment by conducting risk analyses and undertaking conservation initiatives. Identifying risks of biodiversity degradation and loss within its operations helps Kia develop policies that preserve, restore, and enhance biodiversity in local communities. Kia actively manages a range of projects dedicated to the protection of natural capital. These initiatives include tidal flat restoration, The Ocean Cleanup partnership, and the biochar project. For biodiversity conservations, we expand green spaces in proportion to the building area of worksites, creating eco-friendly and relaxing working conditions.
Biodiversity Risk Assessment
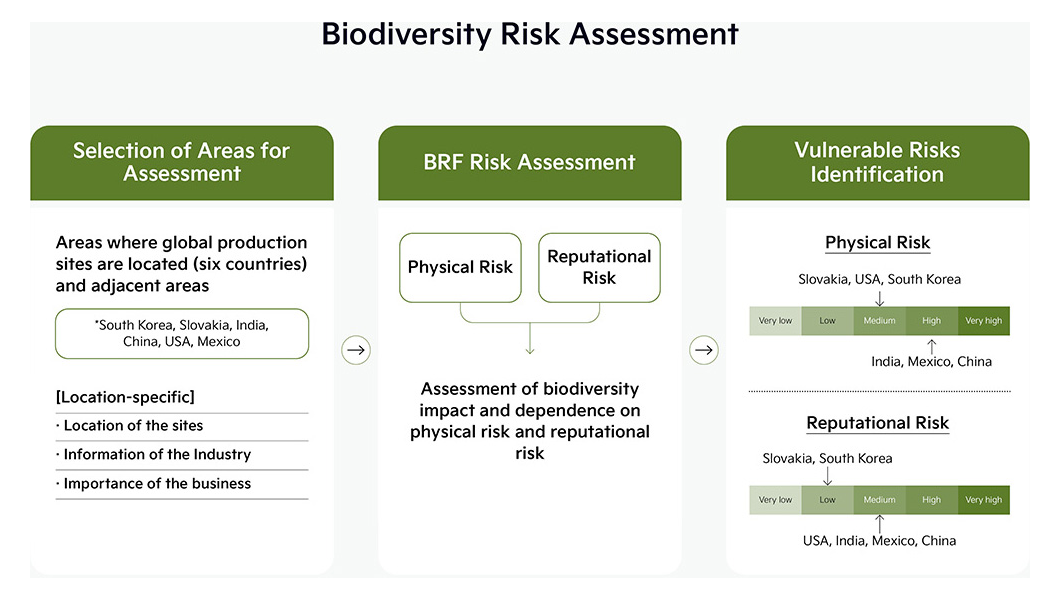
Kia, recognizing the importance of biodiversity, conducts biodiversity risk assessment and strives to actively respond to biodiversity risks-related business impacts and dependence. In 2023, biodiversity risk assessment was conducted for regions where Kia's global business sites are located using WWF's Biodiversity Risk Filter (BRF). We analyzed the dependence and impact of biodiversity based on the region where the business site is located.
According to the result of the assessment, the biodiversity-related reputational risks are low, but some of the physical risks were identified as vulnerable risks for areas where the Kia's production sites are located. It was confirmed that physical risks, such as the risk of Limited Wild Flora & Fauna Availability, although to some degree each areas have different exposure to the risk, is high. Kia will continue to monitor the biodiversity of its business sites and nearby areas, and promote various eco-friendly improvement activities to preserve biodiversity.

